Performance Benchmarking
Optimizing rendering performance is crucial for smooth and responsive TUI applications, especially those with complex layouts or frequent updates. OSUI provides a built-in Benchmark engine wrapper that allows you to easily measure the rendering speed of your components.
Current performance
All the latest benchmark results are in benchmark.csv
The Benchmark Engine
The osui::engine::benchmark module offers the Benchmark<T: Engine> struct, which wraps an existing engine (like Console) and records detailed timing information for its rendering cycles.
How it works:
- You instantiate a
Benchmarkby passing it anotherEngine(e.g.,Console::new()). - When you call
benchmark_engine.run(YourApp {}), theBenchmarkengine takes over. - Instead of running the application indefinitely, it performs a fixed number of render cycles (defaulting to 40 in
Benchmark::run). - For each cycle, it precisely measures the time taken to
renderyour root component. - After all cycles, it clears the screen and returns a
BenchmarkResultcontaining statistics.
BenchmarkResult
The BenchmarkResult struct holds the collected performance metrics:
pub struct BenchmarkResult {
    pub average: u128,      // Average render time in microseconds
    pub min: u128,          // Minimum render time in microseconds
    pub max: u128,          // Maximum render time in microseconds
    pub total_render: u128, // Sum of all render times in microseconds
    pub total: u128,        // Total time spent during the benchmark (including setup)
}
These values are typically in microseconds (µs).
Basic Usage Example
Let's use the simple_benchmark.rs example to see the Benchmark engine in action:
use osui::prelude::*;
use std::sync::Arc; // Needed for Arc<Context>

pub fn main() {
    // 1. Create a Console engine instance.
    let console_engine = Console::new();

    // 2. Wrap it with the Benchmark engine.
    let benchmark_engine = Benchmark::new(console_engine);

    // 3. Run your application (or component) through the Benchmark engine.
    let benchmark_result = benchmark_engine.run(App {}).expect("Failed to run benchmark");

    // 4. Print the results.
    println!("Avg: {} μs", benchmark_result.average);
    println!("Min: {} μs", benchmark_result.min);
    println!("Max: {} μs", benchmark_result.max);
    println!("Tot: {} μs", benchmark_result.total);
    println!("Tot Render: {} μs", benchmark_result.total_render);
}

#[component]
fn App(cx: &Arc<Context>) -> View {
    rsx! {
        "Hello, world!"
    }
    .view(&cx)
}
To run this example:
cargo run --example simple_benchmark
You will see output similar to:
Avg: 1078 μs
Min: 1078 μs
Max: 1078 μs
Tot: 43120 μs
Tot Render: 43120 μs
(Note: Actual values will vary based on your system and terminal emulator.)
Advanced Usage: Benchmarking Complex Scenarios
The benchmark.rs example demonstrates how to benchmark nested components and iterate through different complexity levels. This is useful for identifying performance bottlenecks in specific UI patterns.
use osui::prelude::*;
use std::collections::HashMap; // Needed for HashMap
pub fn main() {
let engine = Arc::new(Benchmark::new(Console::new())); // Wrap Console in Benchmark, then Arc it.
let mut benchmark_results: HashMap<(usize, usize), BenchmarkResult> = HashMap::new();
// Iterate through different levels of nesting (n) and iterations (i)
for i in 0..15 {
for n in 0..15 {
let res = {
let mut results = Vec::with_capacity(6);
// Run each specific benchmark configuration multiple times (e.g., 6)
// to get more consistent results, then pick the median (index 3 after sort).
for _ in 0..6 {
results.push(
engine
.run(App {
n: n * 72, // Scale nesting depth
i: i * 72, // Scale iteration count (for loops)
})
.expect("Failed to run engine"),
);
}
results.sort_by_key(|r| r.total_render); // Sort by total render time
results[3].clone() // Take the median result
};
benchmark_results.insert((i, n as usize), res);
}
}
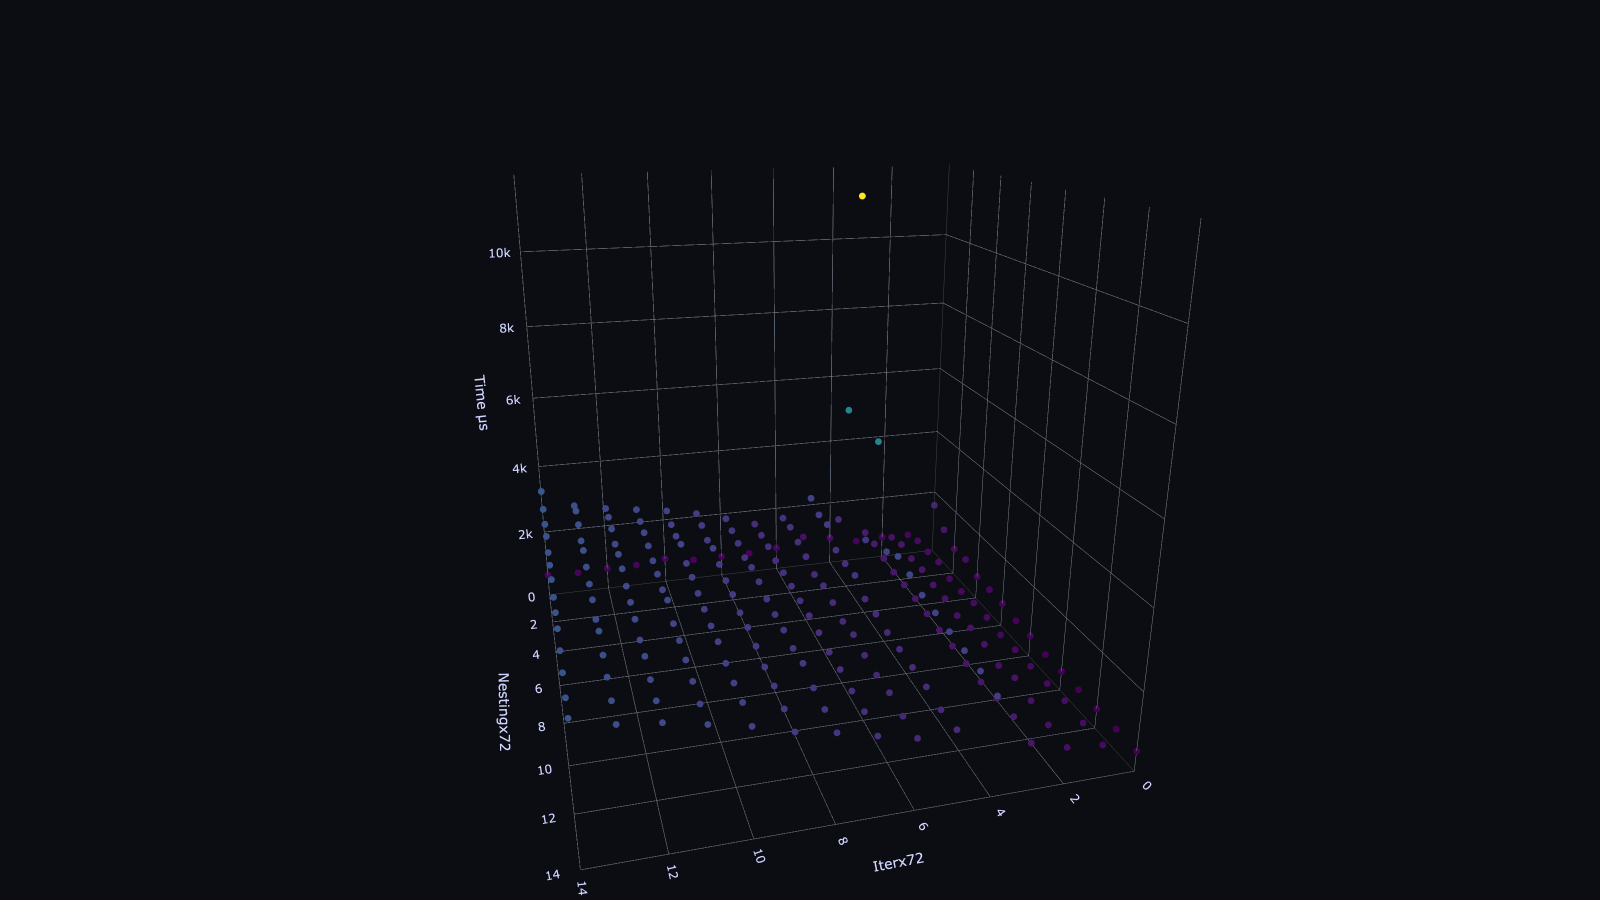
// Output results in CSV format
println!("Iterx72,Nestingx72,Time µs");
for ((i, n), bench) in benchmark_results.iter() {
println!("{i},{n},{}", bench.total_render);
}
}
// A recursive component that creates nested children and loops
#[component]
fn App(cx: &Arc<Context>, n: usize, i: usize) -> View {
let n = n.clone(); // Clone props for closure (necessary for #[component] macro)
let i = i.clone();
if n == 0 {
// Base case: deepest level, render a simple string
rsx! {
"Hello, world!"
}
.view(&cx)
} else {
// Recursive case: create `i` number of children, each with reduced nesting `n-1`
rsx! {
@for _ in (0..i) { // Loop `i` times
App { n: n - 1, i: 0 } // Create a nested App component
}
}
.view(&cx)
}
}
This example:
- Uses an
Arc<Benchmark>to allowrunto be called multiple times. - Iterates through different
n(nesting depth) andi(number of children in a loop) values. - Runs each configuration multiple times and takes the median
total_renderto reduce noise. - Prints the results in CSV format, which can be easily imported into spreadsheet software for analysis (like the
benchmark.csvin the repository).
Interpreting Results
average,min,max: Provide insight into the consistency of your rendering performance. A large difference betweenminandmaxmight indicate inconsistencies or external factors affecting performance.total_render: The sum of all individual render cycle times. This is often the most important metric for overall performance.total: The total time for the benchmark process, including setup. This is less about rendering speed and more about the overhead of the benchmark itself.
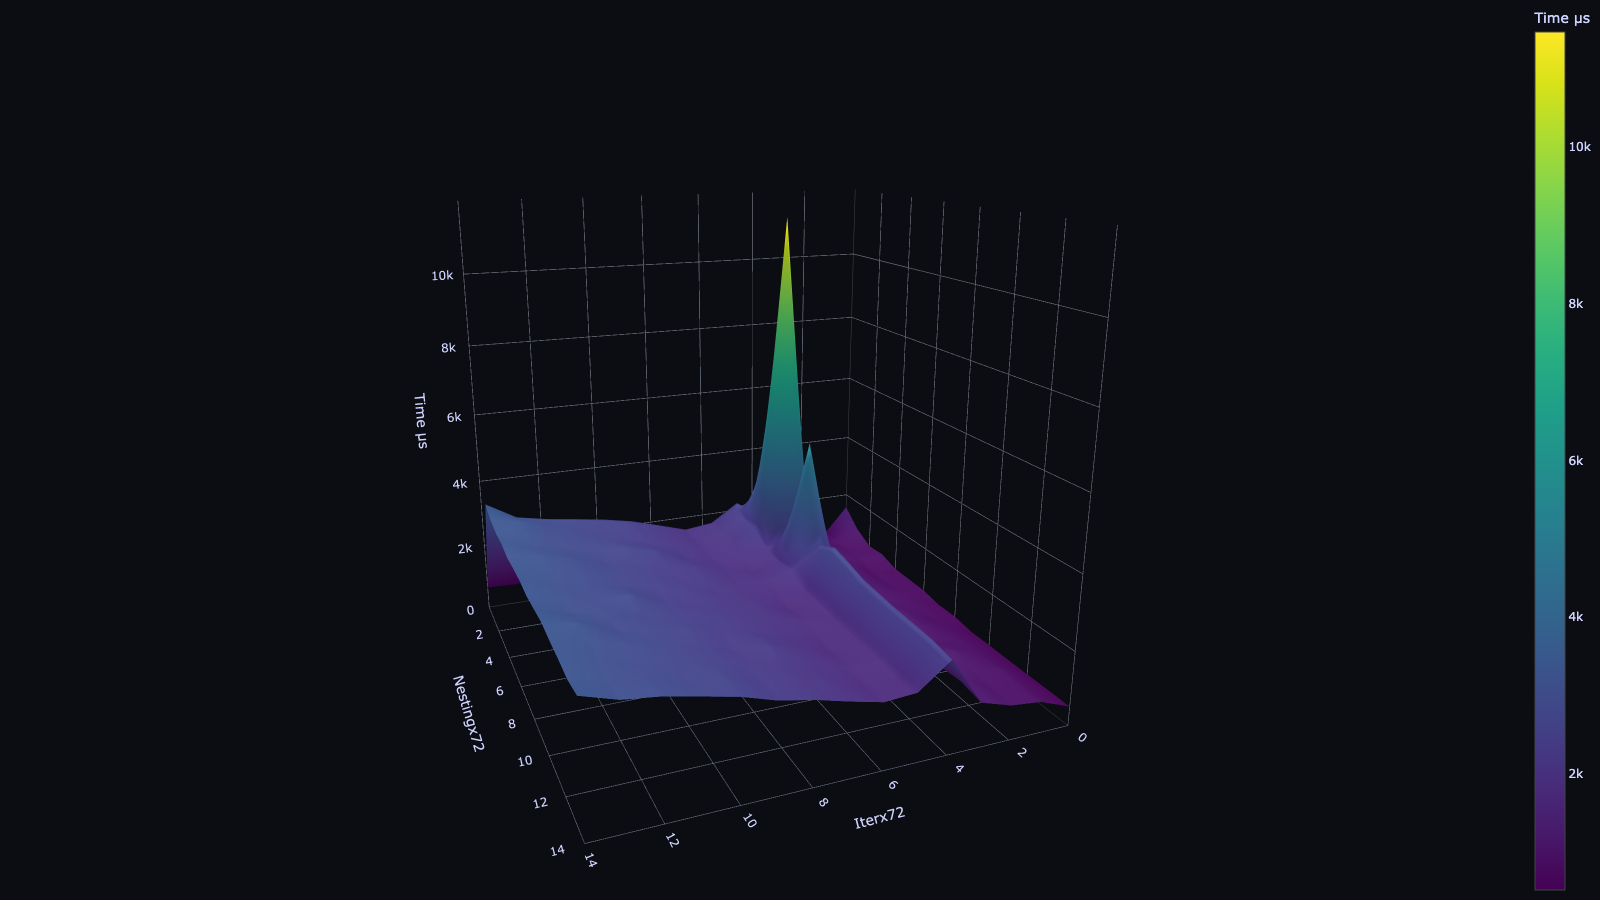
When analyzing benchmarks, look for:
- Linear vs. Non-linear Scaling: How does
total_renderincrease as you increase nesting depth or the number of components? Ideally, it should scale linearly. - Bottlenecks: Can you isolate which components or
rsx!patterns (e.g., complex loops, many dynamic scopes) contribute most to render time? - Regression: Use benchmarks in your CI/CD pipeline to detect performance regressions introduced by new code.
By leveraging OSUI's Benchmark engine, you can gain valuable insights into your TUI application's performance characteristics and make data-driven decisions for optimization.
Next: Learn how to customize OSUI by Implementing a Custom Engine.